Note from Towards Data Science’s editors: While we allow independent authors to publish articles in accordance with our rules and guidelines, we do not endorse each author’s contribution. You should not rely on an author’s works without seeking professional advice. See our Reader Terms for details.
This blog is a tutorial based on our paper: FinRL: A Deep Reinforcement Learning Library for Automated Stock Trading in Quantitative Finance, presented at NeurIPS 2020: Deep RL Workshop.
arxiv.org
The Jupyter notebook codes are available on our Github and Google Colab.
github.com
github.com
A more complete application of FinRL for multiple stock trading can be found in our previous blog.
Overview
To begin with, I would like explain the logic of multiple stock trading using Deep Reinforcement Learning.
We use Dow 30 constituents as an example throughout this article, because those are the most popular stocks.
A lot of people are terrified by the word “Deep Reinforcement Learning”, actually, you can just treat it as a “Smart AI” or “Smart Stock Trader” or “R2-D2 Trader” if you want, and just use it.
Suppose that we have a well trained DRL agent “DRL Trader”, we want to use it to trade multiple stocks in our portfolio.
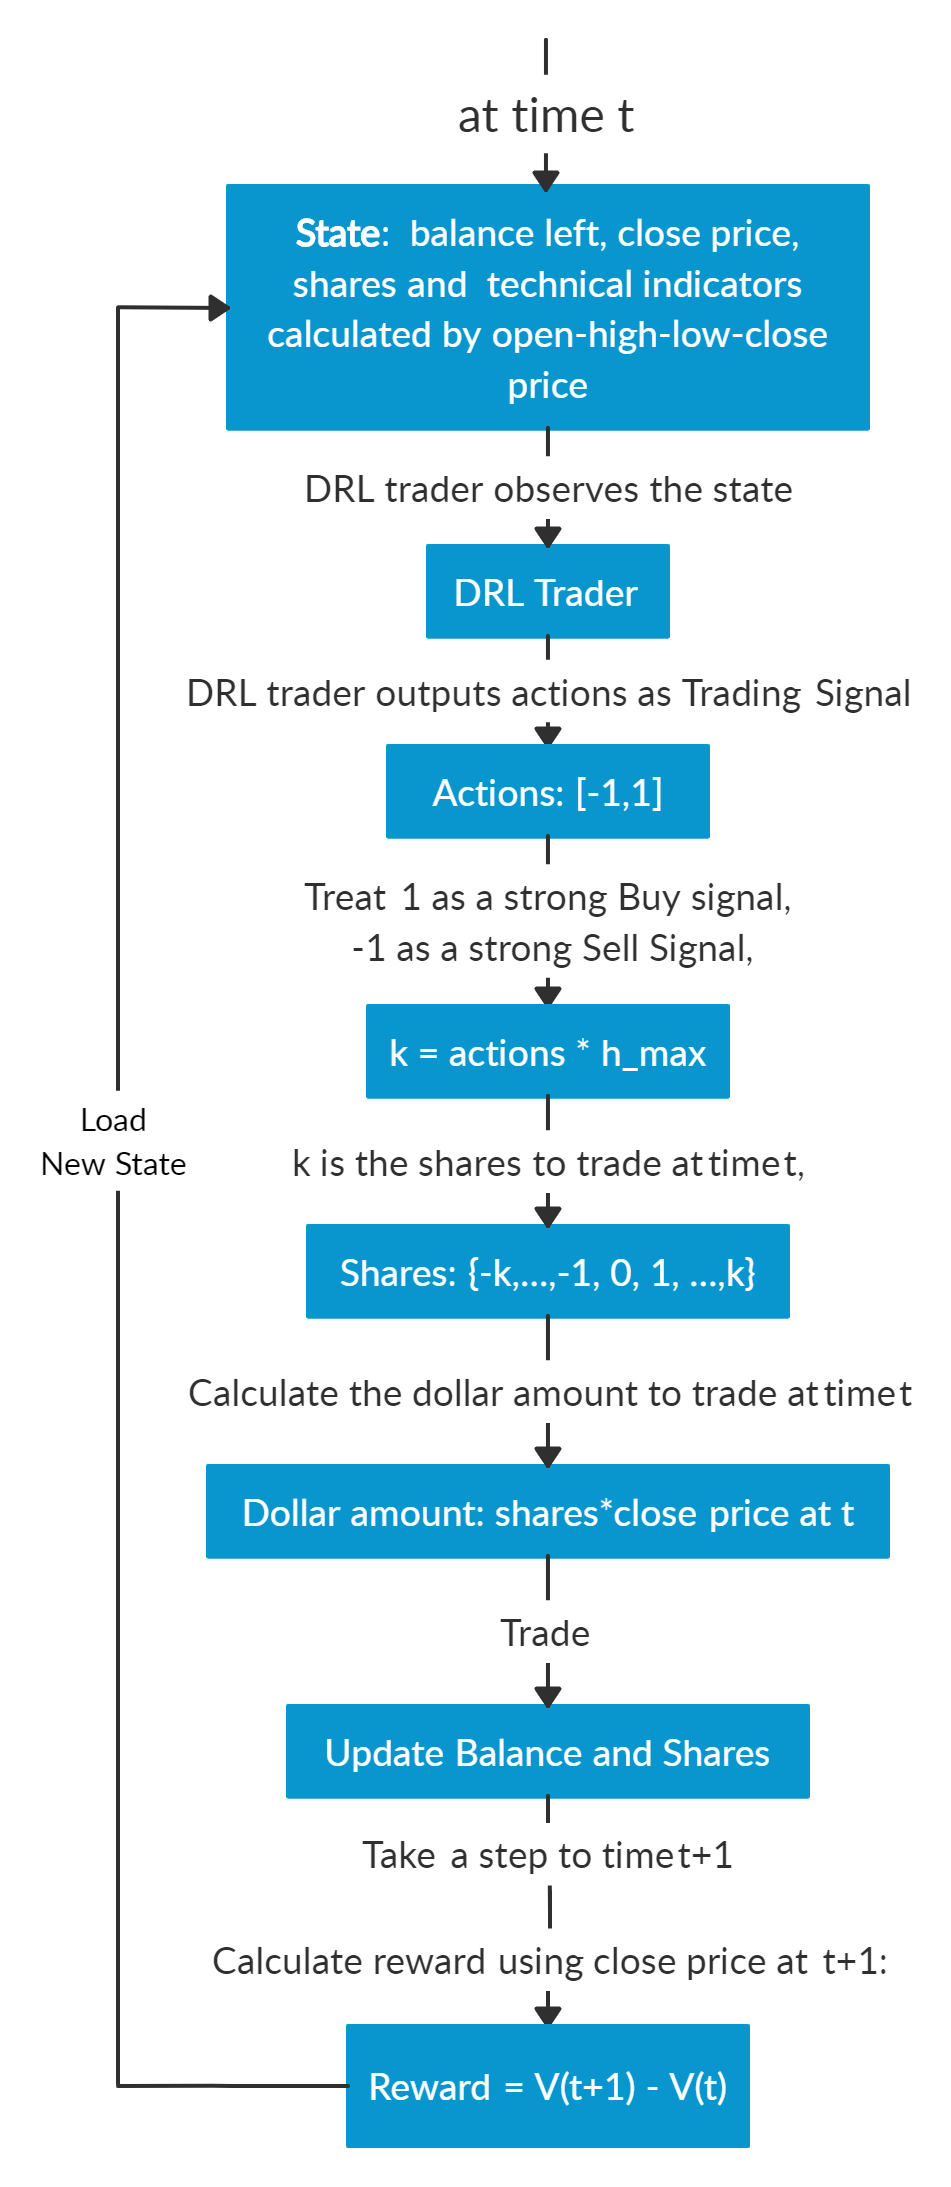
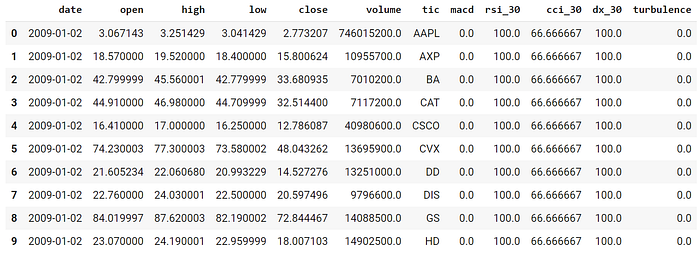
Assume we are at time t, at the end of day at time t, we will know the open-high-low-close price of the Dow 30 constituents stocks. We can use these information to calculate technical indicators such as MACD, RSI, CCI, ADX. In Reinforcement Learning we call these data or features as “states”.
We know that our portfolio value V(t) = balance (t) + dollar amount of the stocks (t).
We feed the states into our well trained DRL Trader, the trader will output a list of actions, the action for each stock is a value within [-1, 1], we can treat this value as the trading signal, 1 means a strong buy signal, -1 means a strong sell signal.
We calculate k = actions *h_max, h_max is a predefined parameter that sets as the maximum amount of shares to trade. So we will have a list of shares to trade.
The dollar amount of shares = shares to trade* close price (t).
Update balance and shares. These dollar amount of shares are the money we need to trade at time t. The updated balance = balance (t) −amount of money we pay to buy shares +amount of money we receive to sell shares. The updated shares = shares held (t) −shares to sell +shares to buy.
So we take actions to trade based on the advice of our DRL Trader at the end of day at time t (time t’s close price equals time t+1’s open price). We hope that we will benefit from these actions by the end of day at time t+1.
Take a step to time t+1, at the end of day, we will know the close price at t+1, the dollar amount of the stocks (t+1)= sum(updated shares * close price (t+1)). The portfolio value V(t+1)=balance (t+1) + dollar amount of the stocks (t+1).
So the step reward by taking the actions from DRL Trader at time t to t+1 is r = v(t+1) − v(t). The reward can be positive or negative in the training stage. But of course, we need a positive reward in trading to say that our DRL Trader is effective.
Repeat this process until termination.
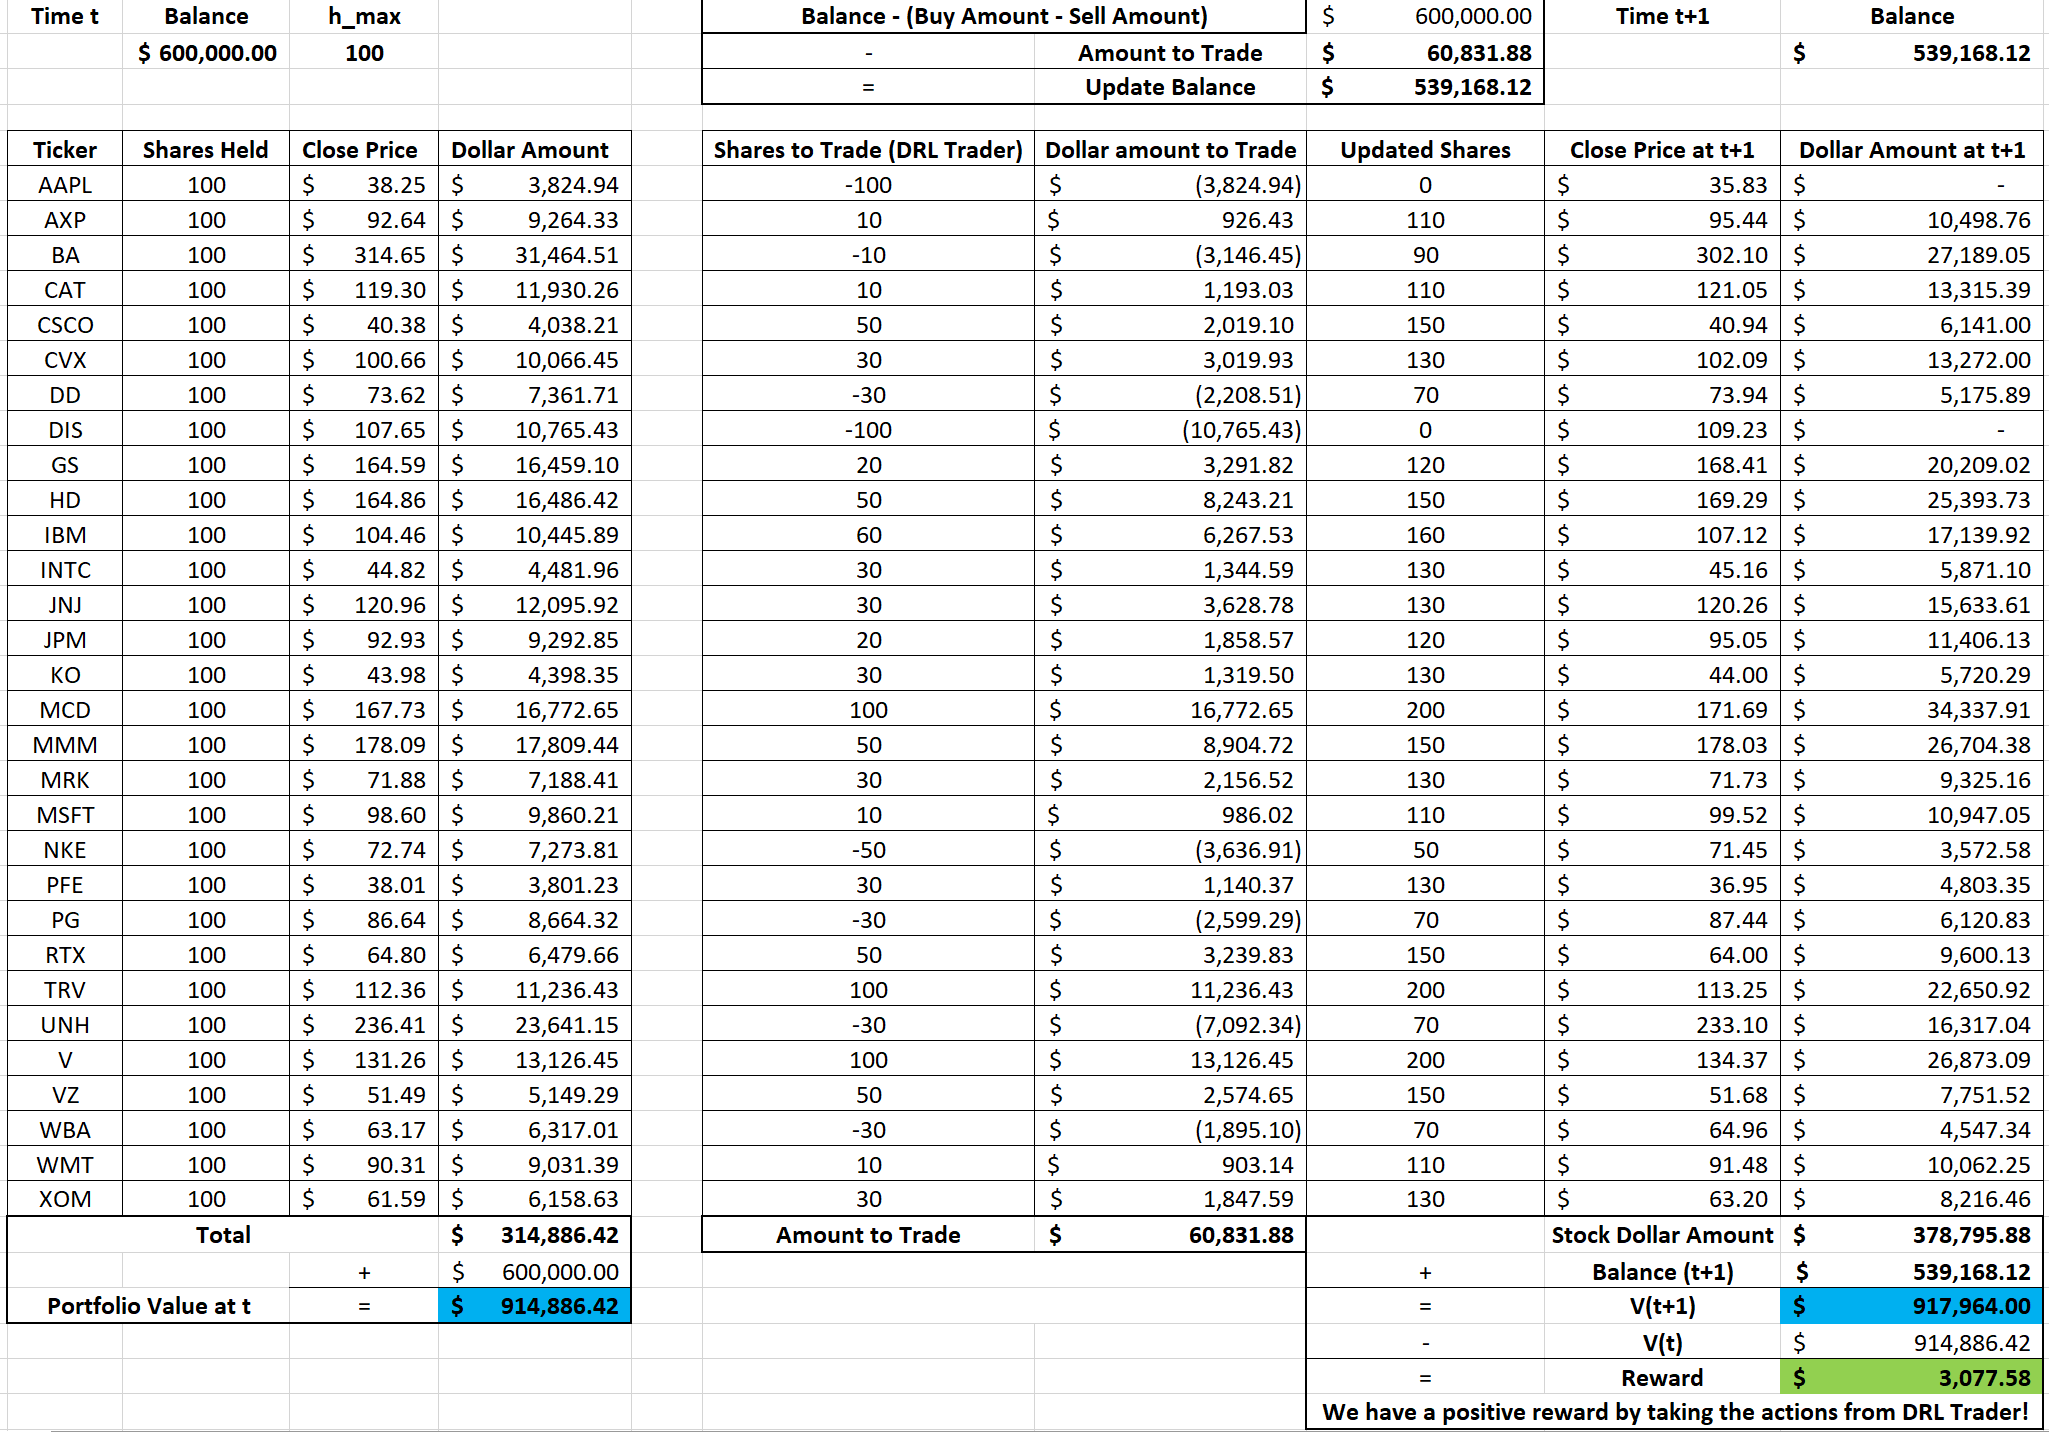
Below are the logic chart of multiple stock trading and a made-up example for demonstration purpose:
Copyright by AI4Finance-Foundation
Multiple stock trading is different from single stock trading because as the number of stocks increase, the dimension of the data will increase, the state and action space in reinforcement learning will grow exponentially. So stability and reproducibility are very essential here.
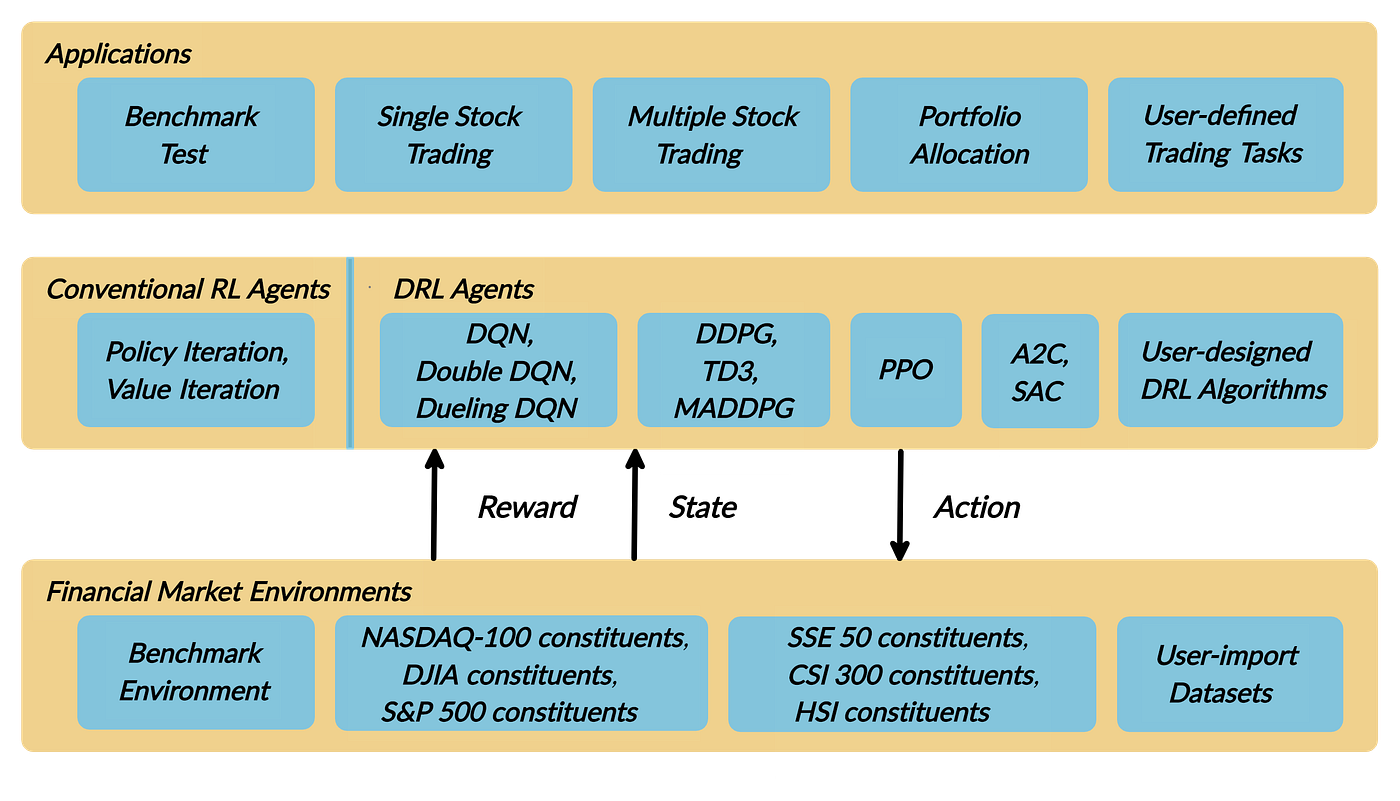
We introduce a DRL library FinRL that facilitates beginners to expose themselves to quantitative finance and to develop their own stock trading strategies.
FinRL is characterized by its reproducibility, scalability, simplicity, applicability and extendibility.
This article is focusing on one of the use cases in our paper: Mutiple Stock Trading. We use one Jupyter notebook to include all the necessary steps.
Copyright by AI4Finance-Foundation
Table of Contents
Problem Definition
Load Python Packages
Download Data
Preprocess Data
Build Environment
Implement DRL Algorithms
Backtesting Performance
Part 1: Problem Definition
This problem is to design an automated trading solution for multiple stock trading. We model the stock trading process as a Markov Decision Process (MDP). We then formulate our trading goal as a maximization problem.
The components of the reinforcement learning environment are:
Action: {−k, …, −1, 0, 1, …, k}, where k denotes the number of shares. For 30 stocks the entire action space is (2k+1)³⁰, in this article we use k≤h_max=100, so the entire action space is around 10⁶⁰. It means we can sample a maximum of 10⁶⁰ pairs of state and action combinations.
State: {balance, close price, shares, MACD, RSI, CCI, ADX}, 181-dimensional vector (30 stocks * 6 + 1)
Reward function: r(s, a, s′) = v′ − v, where v′ and v represent the portfolio values at state s′ and s, respectively
Environment: multiple stock trading for Dow 30 constituents.
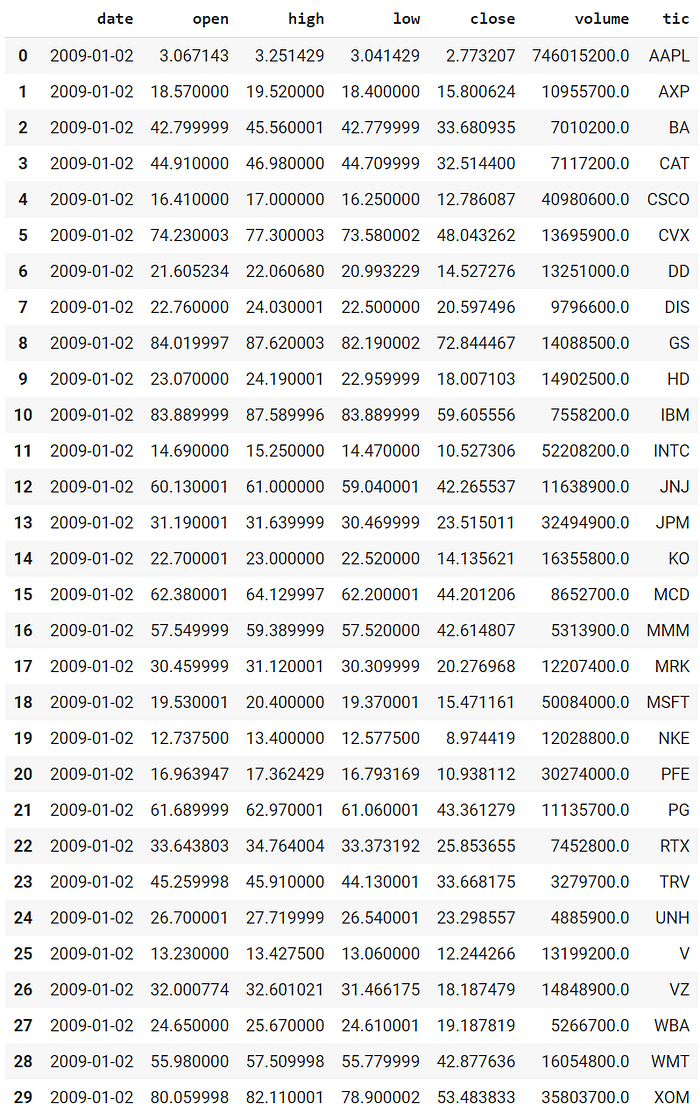
The data of the Dow 30 constituents stocks that we will be using for this case study is obtained from Yahoo Finance API. The data contains Open-High-Low-Close price and volume.
Part 2. Getting Started- Load Python Packages
Install the unstable development version of FinRL:
$$
$$
Import Packages:
Part 3: Download Data
FinRL uses a YahooDownloader class to extract data.
$$
class YahooDownloader: """Provides methods for retrieving daily stock data from Yahoo Finance APIAttributes ---------- start_date : str start date of the data (modified from config.py) end_date : str end date of the data (modified from config.py) ticker_list : list a list of stock tickers (modified from config.py)Methods ------- fetch_data() Fetches data from yahoo API"""
$$
Download and save the data in a pandas DataFrame:

Copyright by AI4Finance-Foundation
Part 4: Preprocess Data
FinRL uses a FeatureEngineer class to preprocess data.
$$
class FeatureEngineer: """Provides methods for preprocessing the stock price dataAttributes ---------- df: DataFrame data downloaded from Yahoo API feature_number : int number of features we used use_technical_indicator : boolean we technical indicator or not use_turbulence : boolean use turbulence index or notMethods ------- preprocess_data() main method to do the feature engineering"""
$$
Perform Feature Engineering:

Copyright by AI4Finance-Foundation
Train & Trade Data Split:
In real life trading, the model needs to be updated periodically using rolling windows. In this article, we just cut the data once into train and trade set.
Part 5: Build Environment
FinRL uses a EnvSetup class to setup environment.
$$
class EnvSetup: """Provides methods for retrieving daily stock data from Yahoo Finance APIAttributes ---------- stock_dim: int number of unique stocks hmax : int maximum number of shares to trade initial_amount: int start money transaction_cost_pct : float transaction cost percentage per trade reward_scaling: float scaling factor for reward, good for training tech_indicator_list: list a list of technical indicator names (modified from config.py)Methods ------- create_env_training() create env class for training create_env_validation() create env class for validation create_env_trading() create env class for trading"""
$$
State Space and Action Space Calculation:
The action space is just the number of unique stocks 30. The state space is 181 in this example.
Initialize an environment class:
User-defined Environment: a simulation environment class.
The environment for training and trading is different in multiple stock trading case.
Training v.s. Trading: turbulence index is used as a risk aversion signal after the actions generated by the DRL algorithms. Turbulence index should not be included in training, because it is not a part of model training, so only a trading environment should include the risk aversion signal.
FinRL provides blueprint for training and trading environments in multiple stock trading.
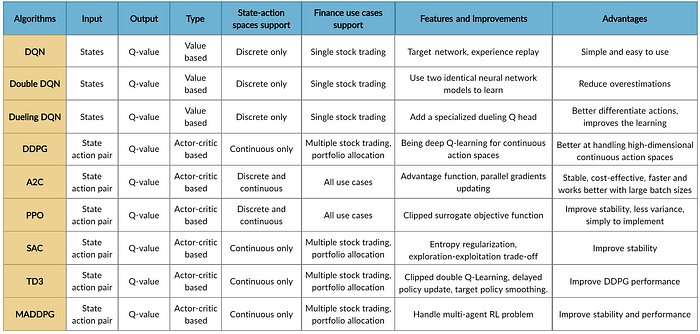
Part 6: Implement DRL Algorithms

Copyright by AI4Finance-Foundation
FinRL uses a DRLAgent class to implement the algorithms.
$$
class DRLAgent: """Provides implementations for DRL algorithmsAttributes ---------- env: gym environment class user-defined classMethods ------- train_PPO() the implementation for PPO algorithm train_A2C() the implementation for A2C algorithm train_DDPG() the implementation for DDPG algorithm train_TD3() the implementation for TD3 algorithm train_SAC() the implementation for SAC algorithm DRL_prediction() make a prediction in a test dataset and get results """
$$
Model Training:
We use Soft Actor-Critic (SAC) for multiple stock trading, because it is one of the most recent state-of-art algorithms. SAC is featured by its stability.
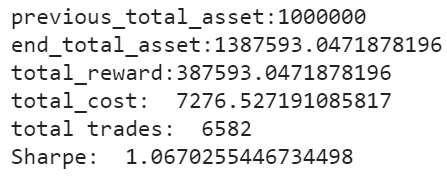
Trading:
Assume that we have $1,000,000 initial capital at 2019/01/01. We use the SAC model to trade the Dow 30 stocks.

Copyright by AI4Finance-Foundation
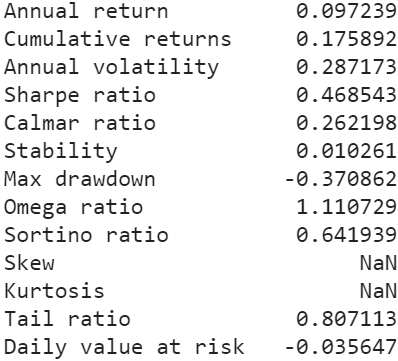
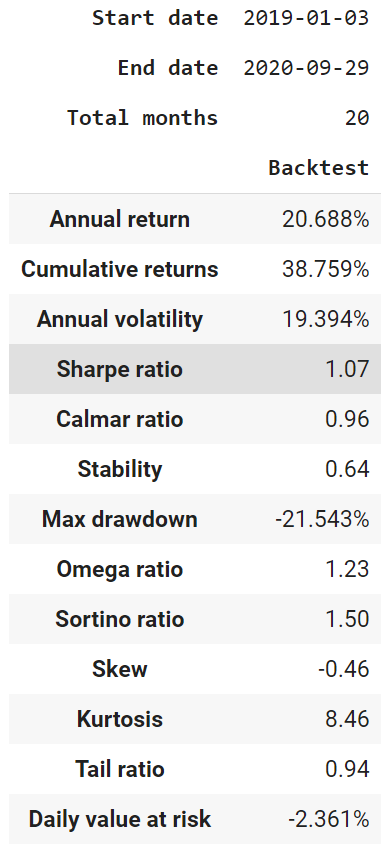
Part 7: Backtesting Performance
FinRL uses a set of functions to do the backtesting with Quantopian pyfolio.
The left table is the stats for backtesting performance, the right table is the stats for Index (DJIA) performance.

 Copyright by AI4Finance-Foundation
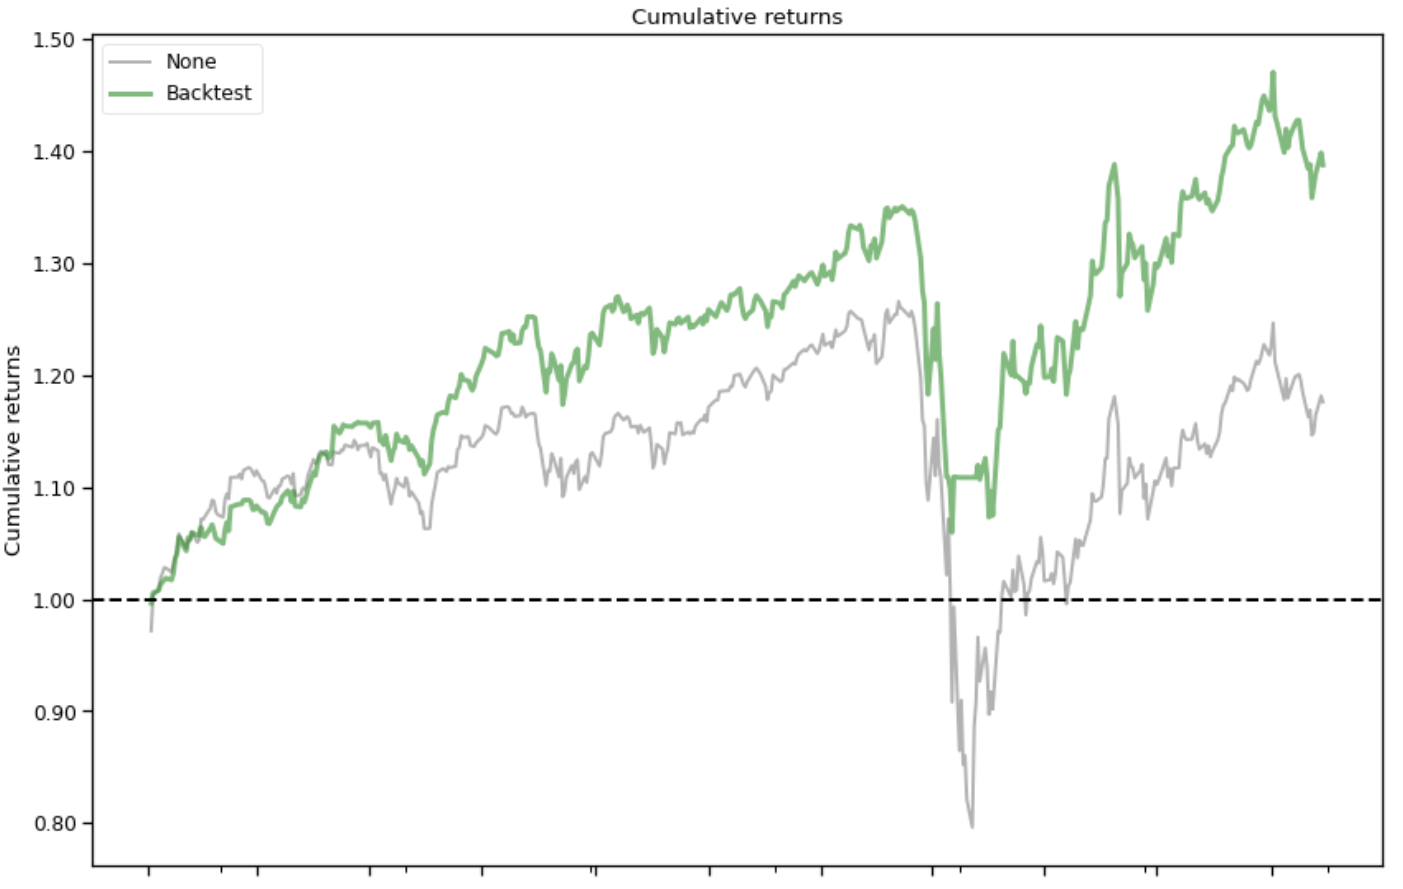
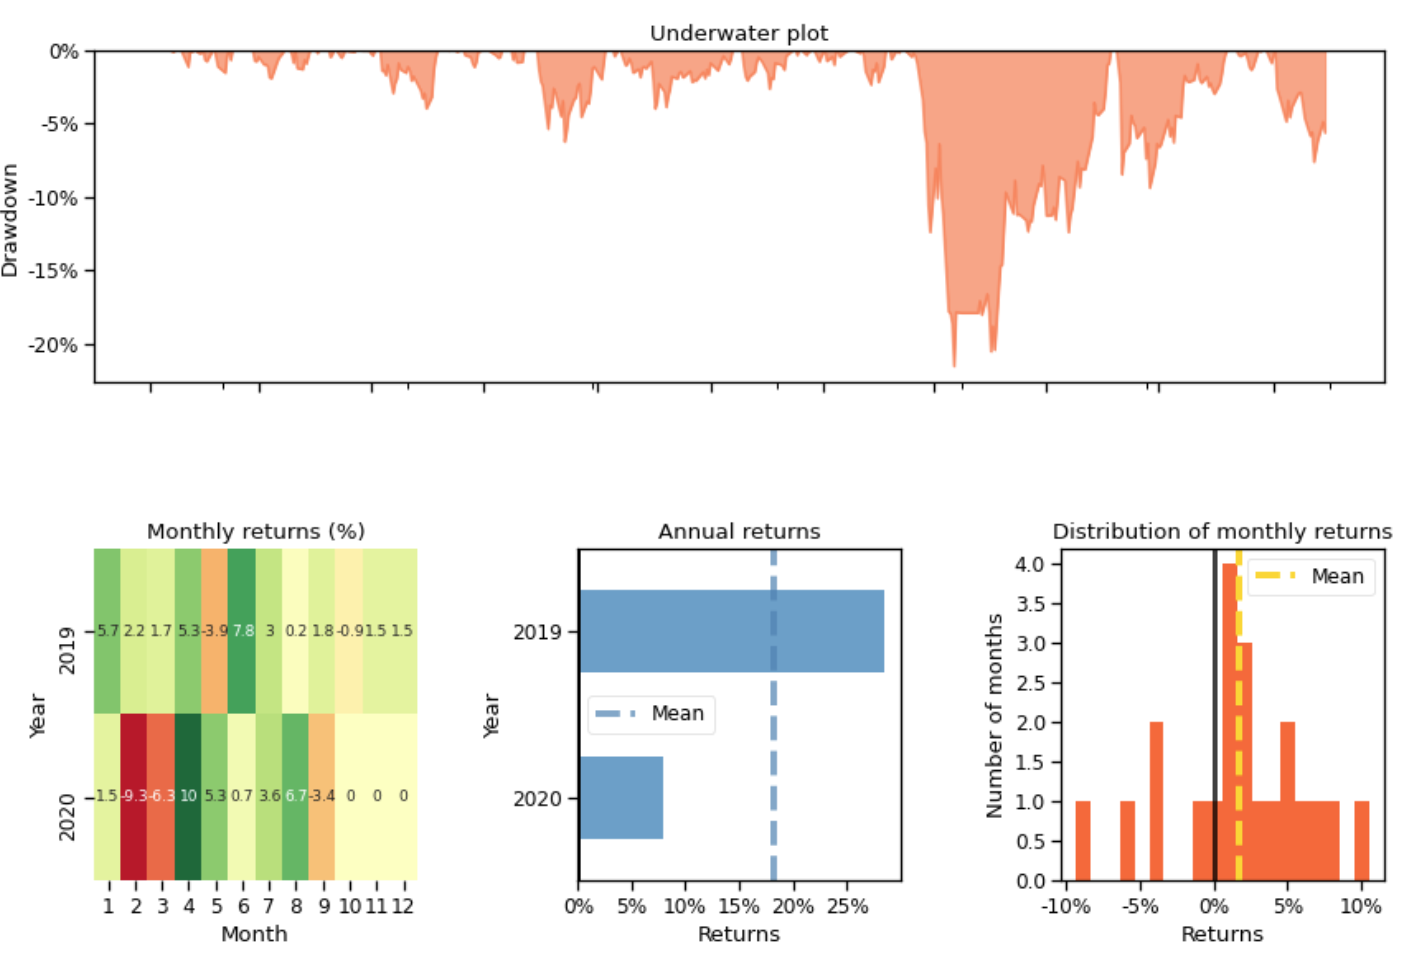
Plots:
Copyright by AI4Finance-Foundation
Copyright by AI4Finance-Foundation
Conclusion
Contributions of FinRL:
FinRL is an open source library specifically designed and implemented for quantitative finance. Trading environments incorporating market frictions are used and provided.
Trading tasks accompanied by hands-on tutorials with built-in DRL agents are available in a beginner-friendly and reproducible fashion using Jupyter notebook. Customization of trading time steps is feasible.
FinRL has good scalability, with a broad range of fine-tuned state-of-the-art DRL algorithms. Adjusting the implementations to the rapid changing stock market is well supported.
Typical use cases are selected and used to establish a benchmark for the quantitative finance community. Standard backtesting and evaluation metrics are also provided for easy and effective performance evaluation.
I hope you found this article helpful and learned something about using DRL for multiple stock trading!
Please report any issues to our Github.